")

Alyssa Black’s US Ecoregions Map Offers a New Lens for Understanding Landscapes
Interview by Hailey Hirst
I have memories of making ecosystem dioramas in grade school science, and learning about the four biomes (desert, forest, grassland, tundra)… but my scientific understanding of what defines specific landscapes and where they converge pretty much stops there. I had never heard of ecoregions (ecological regions or ecozones) until Alyssa Black sent us a new piece of art she’d been working on: her US Ecoregions + Public Lands Map.
Sure, I’ve marvelled at Joshua Trees that only grow in the Mojave Desert, and know that I grew up somewhere on the borderline of the Great Basin Desert meets the Rockies, but I don’t have a good idea about why the life within these regions differs so drastically, or what really paints the lines between them.
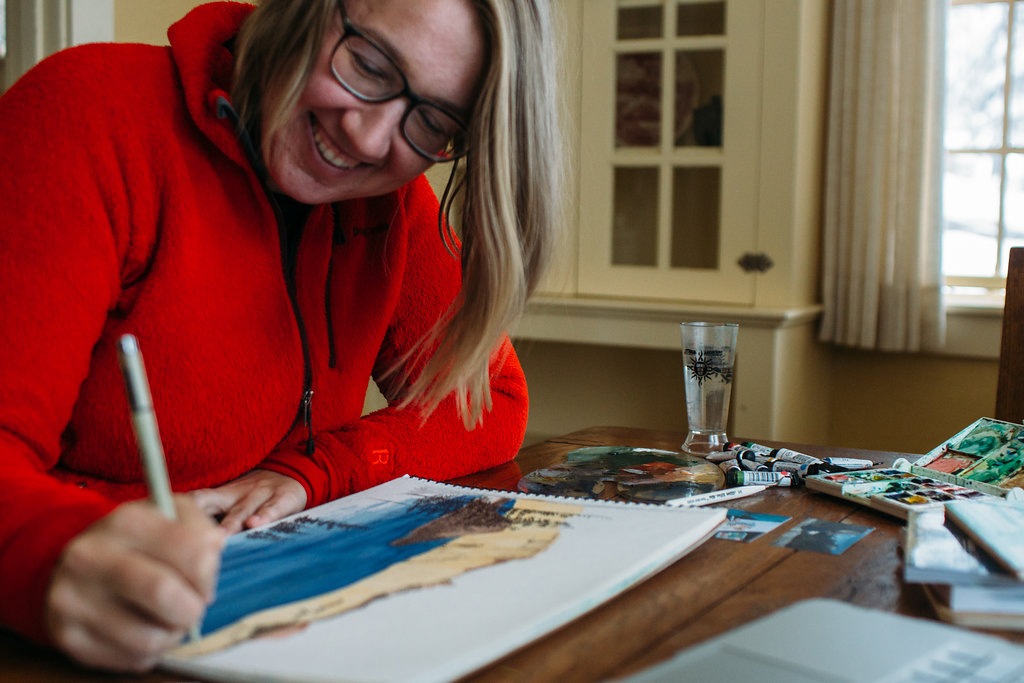
Alyssa has always combined aspects of science with art in her creative design brand, Drawn To Ecology. She began with using watercolor diagrams to help conceptualize and study place, and more recently has illustrated landscapes and the flora within them in minute detail. But this is her first time actually mapping out something directly related to ecology, even though it’s been on her mind for a long time now.


She says, “I have been intrigued with ecoregions for many years and was confused as to why they are so infrequently mentioned, usually only when referring to the maps by the US EPA.”
In learning more from Alyssa, it’s clear that ecoregions are an amazing visual tool for us to better understand what we experience when we are out in nature. But I’ll let her explain it better than I can.
In her own words:
What exactly are ecoregions?
Ecoregions are areas where ecosystems (and the type, quality, and quantity of environmental resources) are generally similar. A further definition: “Ecological regions can be identified by analyzing the patterns and composition of biotic and abiotic phenomena that affect or reflect differences in ecosystem quality and integrity (Omernik 1987, 1995). These phenomena include geology, physiography, vegetation, climate, soils, land use, wildlife, and hydrology.” (Omernik and Griffith, 2014)
When we are out driving to outdoor spaces and see drastic changes in the landscape, from topography and hydrology to species and vegetation, those changes can be visually shown on a map as distinct ecoregions.

The map! And the stickers that come with it to mark sites visited.
How can awareness of them change or enhance our experiences outdoors recreating or otherwise?
Understanding each ecoregion can tell you about the landscape you are experiencing—helping us better understand why we can see a ponderosa pine forest, an intermountain sagebrush-grassland, hike/ski a mountain, and then go to an alpine lake all within a few hours (like around Bend, Oregon, for example, where four different ecoregions converge).
They also allow us to better understand the types of species we will experience when we are out recreating somewhere. Do you like bird watching? Mushroom hunting? Understanding the ecoregions where the species you are looking for live (or migrate to) can help you better locate them.
What inspired you to finally create this map after years of creating other things with Drawn to Ecology?
To be completely honest and vulnerable, I was contemplating closing Drawn to Ecology this year and realized that I couldn’t do that without having brought this map to reality. It was the very first idea I thought of when starting the business 4 years ago. As someone who comes from a science and academic background, actually creating maps for a living before, it was fitting that this map was the first thing I thought of creating as Drawn to Ecology.
It unfortunately took 4 years to finally bring it to life, but the creation of the map helped me get through a very difficult time in the business, reigniting a spark I had let fear and doubt distinguish, and the response to the map has given me new motivation to continue with science communication.

The process of creating over the years was paired with a lot of imposter syndrome, fear and doubt that nobody would find this interesting but me, and then worrying about the accuracy of the information on the map. I let that voice in my head stop me from moving forward.
But over the years I grew an amazing community of outdorkers, people who fiercely love the outdoors, who nerd out over the science and ecology of the places they recreate (they usually love nature puns) and who appreciate my blend of scientific illustrations and whimsical anthropomorphizing of species. That community showed me that there are others out there who would love for this map to come to life and learn all about ecoregions.
Can you describe your creative process in bringing this design to life? What sources/experiences did you draw upon in choosing everything that’s included?
Originally I started the map as a large scale watercolor piece but realized that all of the pieces of information being layered in the map were created using different map projections. (This information is about to get a bit nerdy, but if you love topographic maps, honestly if you like maps in general this will be interesting I promise!)
What is a map projection?
The Earth is the shape of a sphere, or close to it, and when you flatten a sphere it can’t happen without distortion. Think of it like trying to flatten an orange peel keeping all of the pieces connected. It doesn’t smooth out to be a flat 2D peel. It has gaps. Each map projection has strengths and weaknesses to limiting the distortion and it’s up to the cartographer to determine what the best projection is for the purpose of the map.
This is important to understand because many of the layers in the US Ecoregions and Public Lands Map have different map projections. So in order for me to accurately layer these to show information in the same physical location I had to use several points of reference to merge and layer the topography (at this scale the topography used is actually called shaded relief), ecoregions, and public land boundaries.
Here is an example of what this looks like:

The image shown is the addition of the CDT trail and there are two versions in the map. They are from two different maps and have the same reference points, the state lines, and you can see how the solid state lines differ from the dashed state lines, this is due to a difference in map projections.
Now, I could have taken creative license and just layered the items to create a hand drawn original but the cartographer in me just couldn’t do that (one of the many reasons this map took so long to create). I wanted the map to accurately show you where all our public lands are located and what ecoregions are in each of the public lands.
As I layered the public land boundaries on top of the ecoregions, though, I realized that the map itself may have too much information and not be legible. The lines became jumbled all together and I had to ask myself: is this solely a map that teaches people about ecoregions or is this a map that introduces people to ecoregions? Are the ecoregions even important or should I just make a map that has all of our public lands?
-

- Layer 1: Public Lands; BLM in yellow, USFS with green outline, and the National Park Lands thicker green outline and dots.
-

- Layer 2: All of the ecoregions underneath the BLM, USFS, and NPS lands.
-

- All 3 layers of the map; Public Lands, Shaded Relief (topography), and the Ecoregions.
It would have been easy to just scrap the ecoregions and create a map solely on featuring National Park Lands, US Forests, and Bureau of Land Management areas, but I realized that even if I can’t have all the labels for the ecoregions on the map and you can’t see all of them underneath the BLM areas, it was still worth it to introduce people to the concept.
I also think it’s valuable to share this process, because this is true behind-the-scenes of how pieces are created by a Science Communicator. What to include, how to illustrate it, and then the ultimate question of, why are people going to be interested in this, are all part of the creative process. Having topography (shaded relief), ecoregions, and public lands in the same map is the perfect blend of the things I love; science, ecology, parks, and art. Achieving both an educational and fun map, I added the NPS Badges because who doesn’t love putting stickers on a map?!
Are Land Acknowledgements included in the map?
Yes and no. Part of the creative process was realizing there is only so much information that can fit on a map and that adding land acknowledgements for every public land just wouldn’t be legible. There is a Land Acknowledgment on the map though under Alaska:
This map acknowledges that our Public Lands are stolen land of Indigenous and Native people. We support the Land Back Movement. To learn more visit LandBack.org or NDNCollective.org. Although this map doesn’t include Land Acknowledgments for each Public Land, there will be another map, we encourage everyone to research the Indigenous Tribes, who’s land you are recreating on, when in each of the Public Lands labeled. Find out: the Indigenous people to whom the land belongs, how to respectfully recreate on their land, the history of the land and any related treaties, names of living Indigenous people from these communities, Indigenous place names and language, and correct pronunciation for the names of the Tribes, places, and individuals.

And a final note:
Artist, science communicator, and mental health advocate Alyssa, the outdorker behind Drawn to Ecology, blends scientific illustrations with whimsical anthropomorphizing of species to allow every adventurer to learn about the places they recreate and tap into the healing powers of nature through the use of art. Find her on Instagram @drawntoecology.
- About the Author
- Latest Posts

Hailey Hirst is She Explores‘ digital content editor and brand designer. Her leash-trained tuxedo cat and young daughter join her on the trails close to home in British Columbia and Idaho.

Be the first to comment